Chapter 10: Extending Loglinear Models
Summary
Loglinear models have special forms to represent additional structure in the variables in contingency tables. Models for ordinal factors allow a more parsimonious description of associations. Models for square tables allow a wide range of specific models for the relationship between variables with the same categories. Another extended class of models arise when there are two or more response variables.Contents
- 10.1. Models for ordinal variables
- 10.2. Square tables
- 10.3. Three-way and higher-dimensional tables
- 10.4. Multivariate responses
- 10.5. Chapter summary
- 10.6. Lab exercises
Selected figures
view R code-
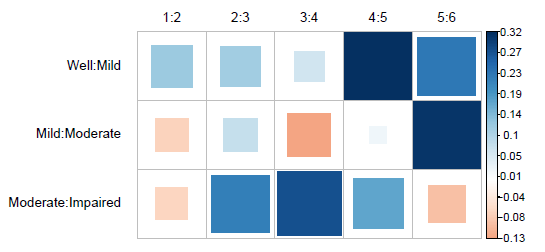
Figure 10.2
Shaded-square plot of the local log odds ratios in the Mental data. -
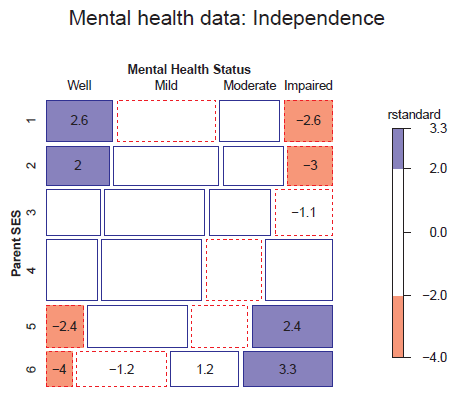
Figure 10.3
Mosaic display of the independence model for the mental health data. -
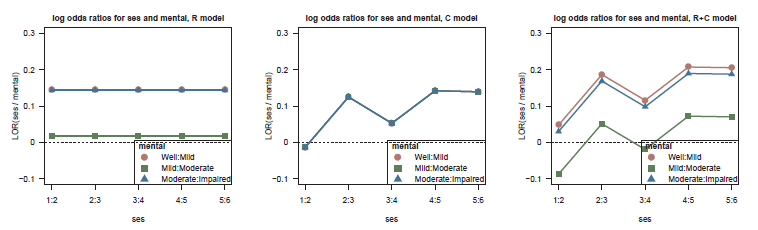
Figure 10.4
Log odds ratio plots for the R (left), C (middle), and R+C (right) models fit to the mental health data. -
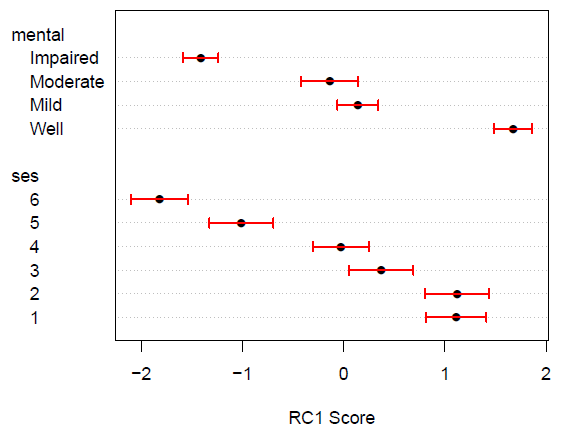
Figure 10.5
Dotchart of the scaled category scores for the RC(1) model fit to the mental health data. Error bars show +/- 1 standard error. -
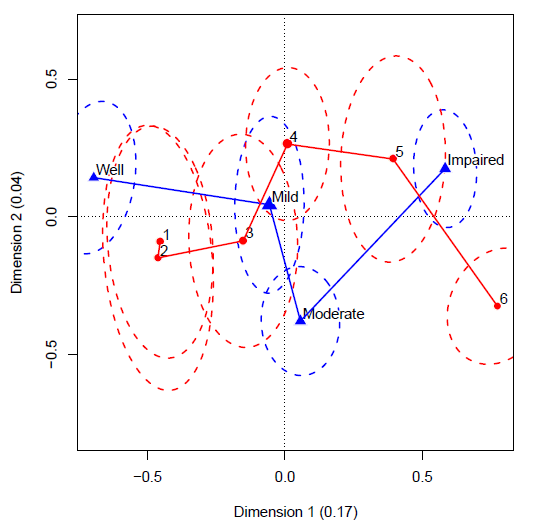
Figure 10.7
Scaled category scores for the RC(2) model fit and plotted using the logmult package. The 68% confidence ellipses correspond to bivariate +/- 1 confidence intervals for the category parameters. -
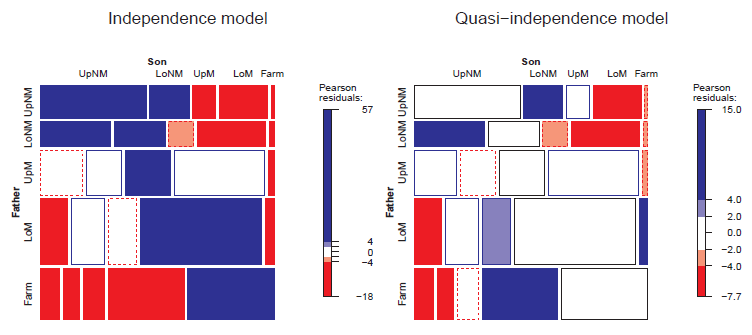
Figure 10.10
Mosaic displays for the Hauser79 data. Left: independence model; right:quasi-independence model. -

Figure 10.12
Mosaic display for the quasi-crossings model fit to the Hauser79 data. -
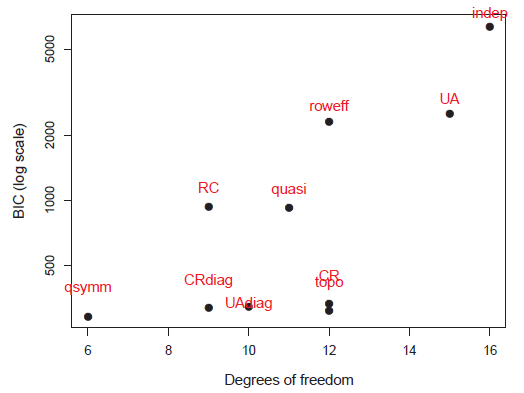
Figure 10.13
Model comparison plot for the models fit to the Hauser79 data. -
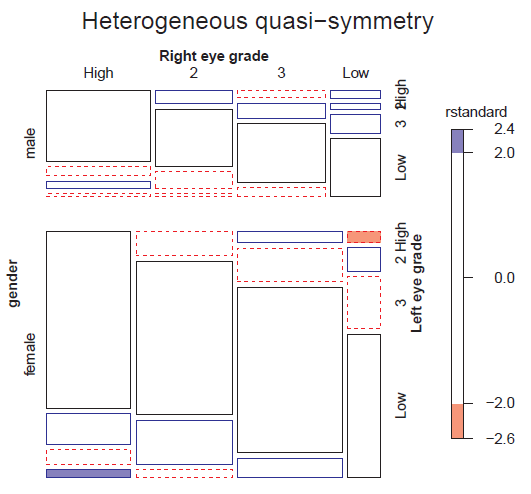
Figure 10.15
Mosaic display for the model of heterogeneous quasi-symmetry fit to the VisualAcuity data. -
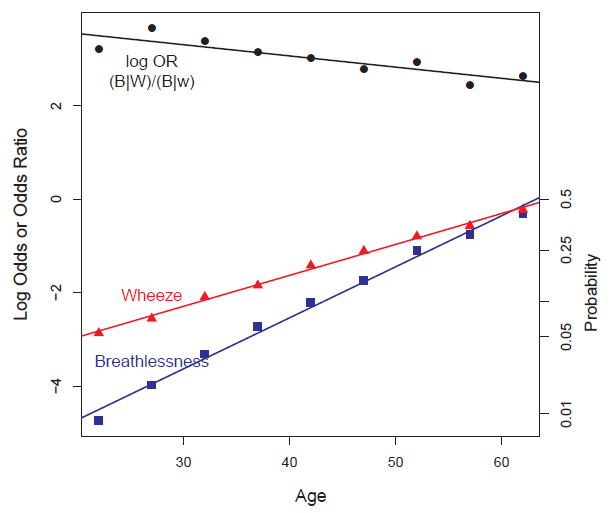
Figure 10.16
Empirical logits and log odds ratio for breathlessness and wheeze in the CoalMiners data. The lines show separate linear regressions for each function. The right vertical axis shows equivalent probabilities for the logits. -
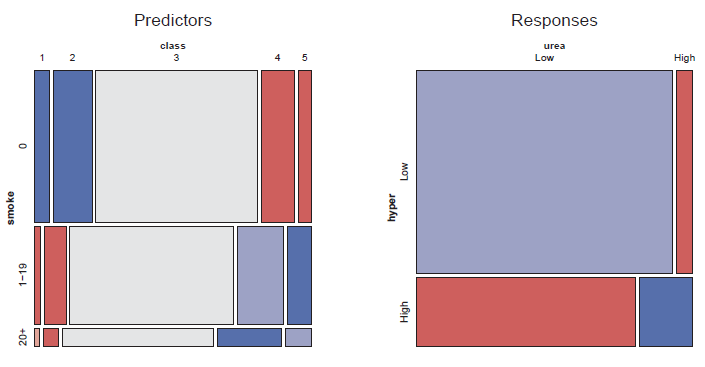
Figure 10.20
Mosaic displays for Toxaemia data: Predictor and response associations. -
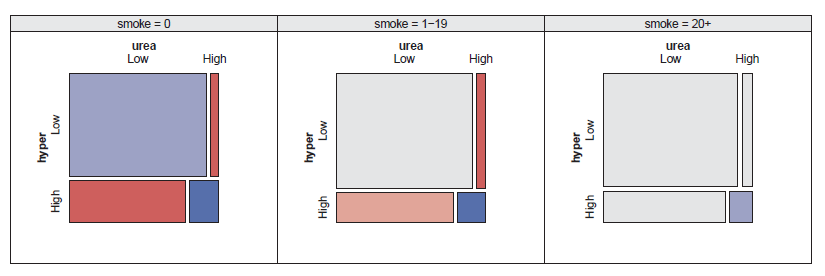
Figure 10.21
Toxaemia data: Response association conditioned on smoking level. -
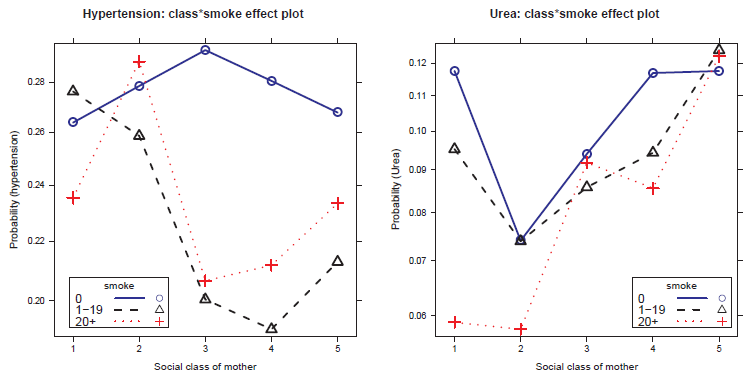
Figure 10.25
Effect plots for hypertension and urea, by social class of mother and smoking. -
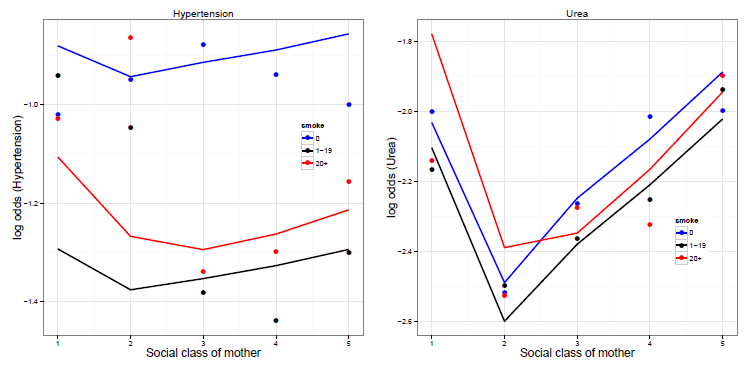
Figure 10.26
Observed (points) and fitted (lines) logits for the Toxaemia data under Model 2.