Chapter 8: Models for Polytomous Responses
Summary
This chapter generalizes logistic regression models for a binary response to handle a multi-category (polytomous) response. Different models are available depending on whether the response categories are nominal or ordinal. Visualization methods for such models are mostly straightforward extensions of those used for binary responses.Contents
- 8.1. Ordinal response
- 8.2. Nested dichotomies
- 8.3. Generalized logit model
- 8.4. Chapter summary
- 8.5. Lab exercises
Selected figures
view R code-
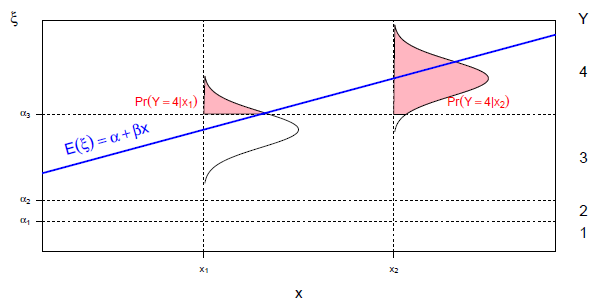
Figure 8.2
Latent variable representation of the proportional odds model for m = 4 response categories and a single quantitative predictor, x. -
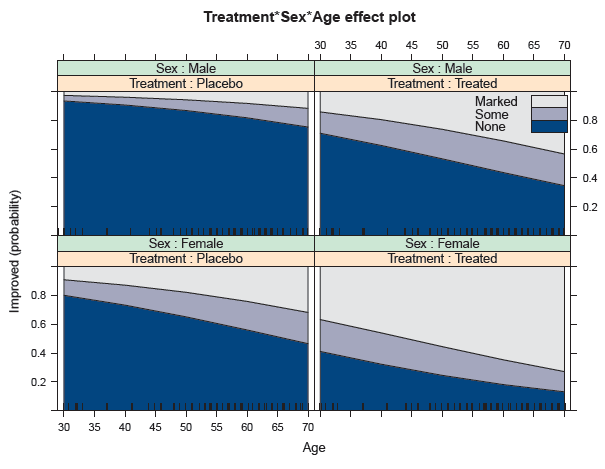
Figure 8.6
Effect plot for the effects of Treatment, Sex, and Age in the Arthritis data. -
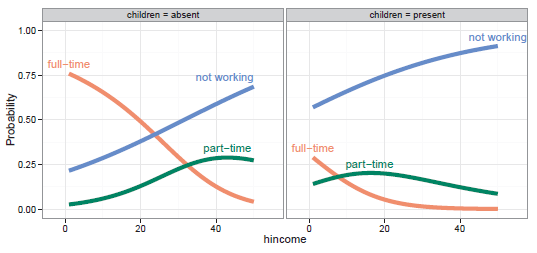
Figure 8.10
Fitted probabilities from the models for nested dichotomies fit to the data on women’s labor force participation. -
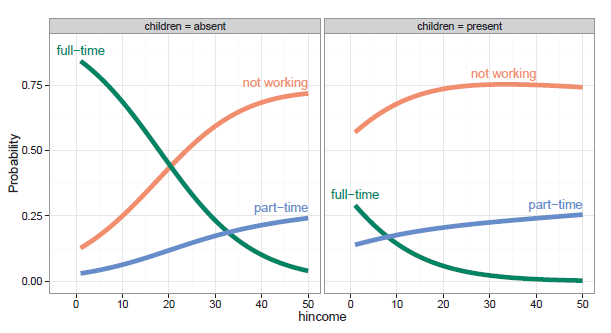
Figure 8.12
Fitted probabilities from the generalized logit model fit to the data on women’s labor force participation.