Chapter 5: Mosaic Displays for n-Way Tables
Summary
Mosaic displays help to visualize the pattern of associations among variables in two-way and larger tables. Extensions of this technique can reveal partial associations, marginal associations, and shed light on the structure of loglinear models themselves.Contents
- 5.1. Introduction
- 5.2. Two-way tables
- 5.3. The strucplot framework
- 5.4. Three-way and larger tables
- 5.5. Model and plot collections
- 5.6. Mosaic matrices for categorical data
- 5.7. 3D mosaics
- 5.8. Visualizing the structure of loglinear models
- 5.9. Related visualization methods
- 5.10. Chapter summary
- 5.11. Lab exercises
Selected figures
view R code-
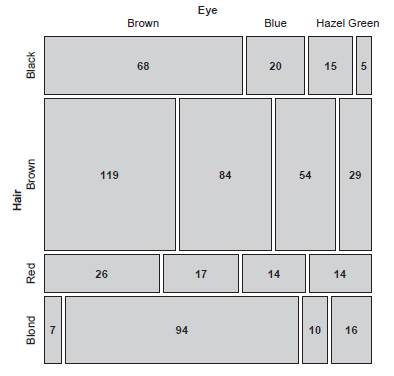
Figure 5.1
Basic mosaic display for hair color and eye color data. The area of each rectangle is proportional to the observed frequency in that cell, shown as numbers. -
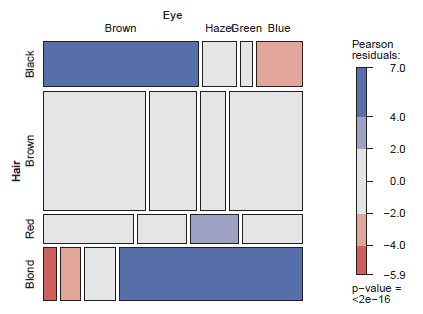
Figure 5.4
Two-way mosaic for hair color and eye color, reordered. The eye colors were reordered from dark to light, enhancing the interpretation. -
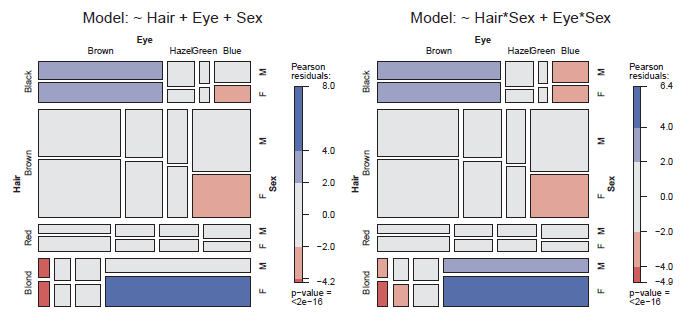
Figure 5.13
Mosaic displays for other models fit to the data on hair color, eye color, and sex. Left: Mutual independence model; right: Conditional independence of hair color and eye color given sex. -
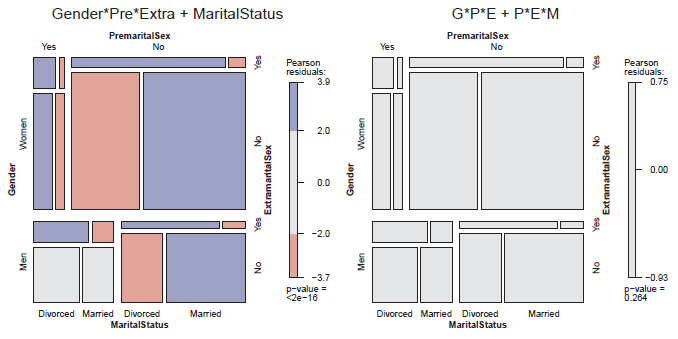
Figure 5.16
Four-way mosaics for the PreSex data. The left panel fits the model [GPE][M]. The pattern of residuals suggests other associations with marital status. The right panel fits the model [GPE][PEM]. -
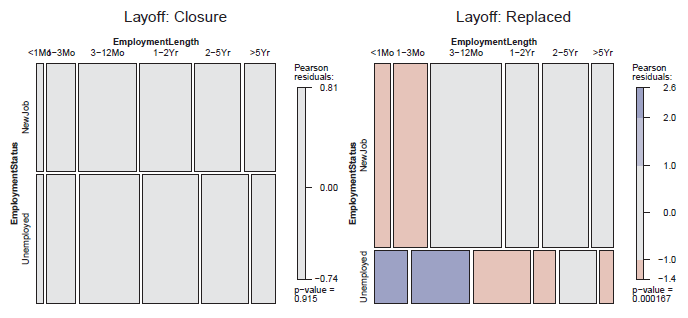
Figure 5.19
Mosaic displays for the employment status data, with separate panels for cause of layoff. -
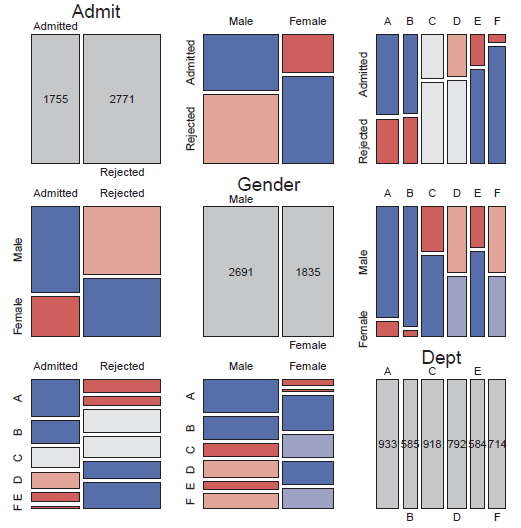
Figure 5.24
Mosaic matrix of the UCBAdmissions data showing bivariate marginal relations.