Chapter 4: Two-Way Contingency Tables
Summary
The analysis of two-way frequency tables concerns the association between two variables. A variety of specialized graphical displays help us to visualize the pattern of association, using area of some region to represent the frequency in a cell. Some of these methods are focused on visualizing an odds ratio (for 2 x 2 tables), or the general pattern of association, or the agreement between row and column categories in square tables.Contents
- 4.1. Introduction
- 4.2. Tests of association for two-way tables
- 4.3. Stratified analysis
- 4.4. Fourfold display for 2 x 2 tables
- 4.5. Sieve diagrams
- 4.6. Association plots
- 4.7. Observer agreement
- 4.8. Trilinear plots
- 4.9. Chapter summary
- 4.10. Lab exercises
Selected figures
view R code-
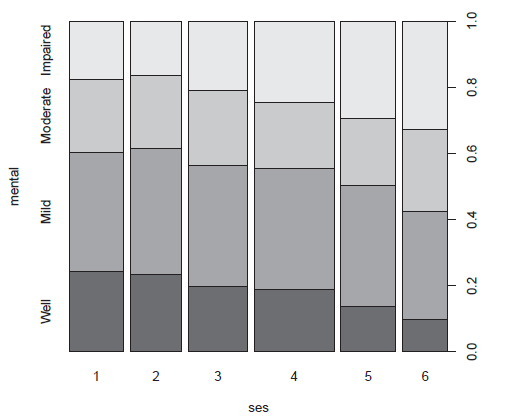
Figure 4.2
Spineplot of the Mental data. -
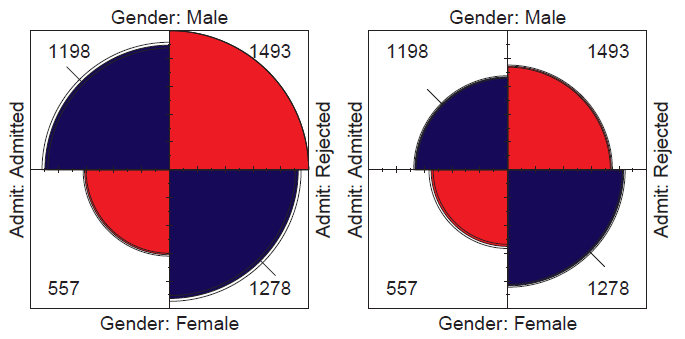
Figure 4.2
Fourfold displays for the Berkeley admission data. Left: unstandardized; right: equating the proportions of males and females. -
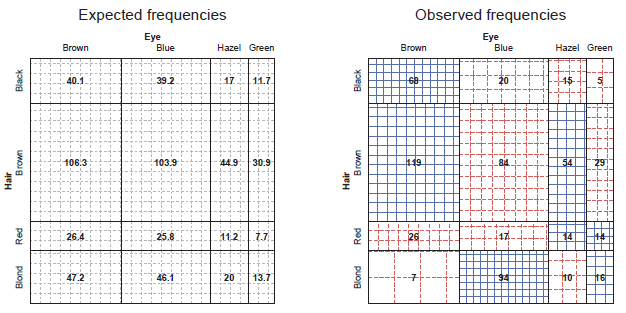
Figure 4.9
Sieve diagrams for the HairEyeColor data. Left: expected frequencies shown in cells as numbers and the number of boxes; right: observed frequencies shown in cells. -
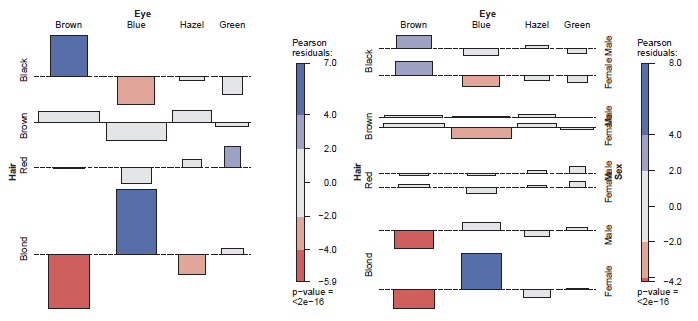
Figure 4.17
Association plot for the hair-color eye-color data. Left: marginal table, collapsed over gender; right: full table. -
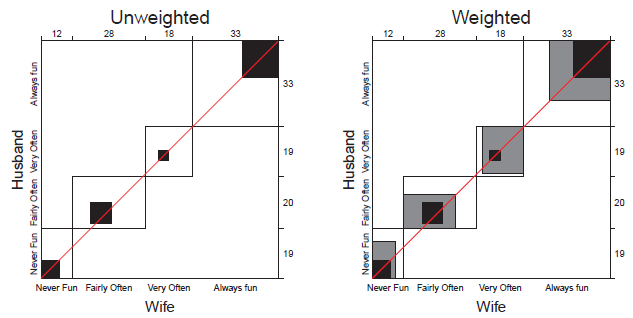
Figure 4.18
Agreement charts for husbands’ and wives’ sexual fun. Left: unweighted chart, showing only exact agreement; right: weighted chart, using weight w1 = 8/9 for a one-step disagreement. -
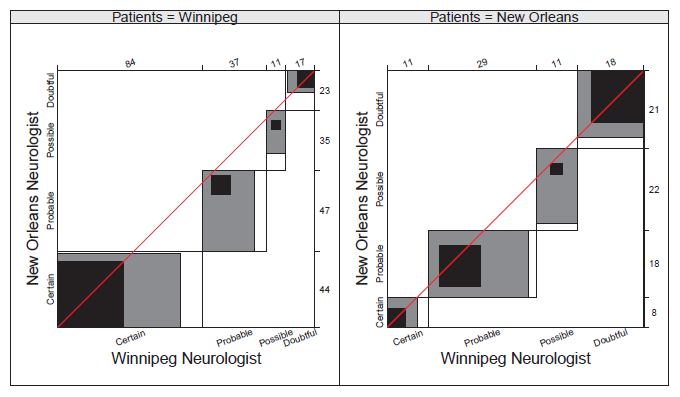
Figure 4.20
Weighted agreement charts for both patient samples in the MSPatients data. Departure of the middle rectangles from the diagonal indicates lack of marginal homogeneity. -
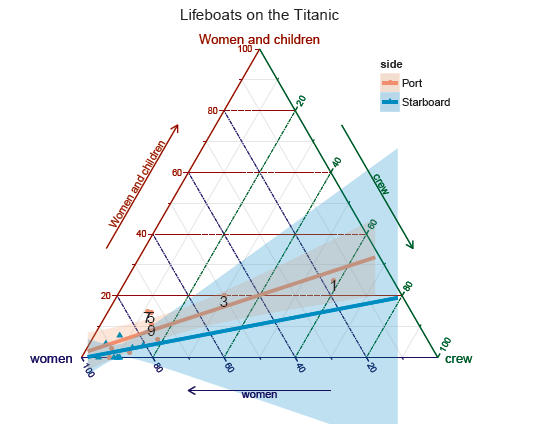
Figure 4.22
Lifeboats on theTitanic , showing the composition of each boat. Boats with more than 10% male passengers are labeled.