Chapter 3: Fitting and Graphing Discrete Distributions
Summary
Discrete data often follow various theoretical probability models. Graphic displays are used to visualize goodness of fit, to diagnose an appropriate model, and determine the impact of individual observations on estimated parameters.Contents
- 3.1. Introduction to discrete distributions
- 3.2. Characteristics of discrete distributions
- 3.3. Fitting discrete distributions
- 3.4. Diagnosing discrete distributions: Ord plots
- 3.5. Poissonness plots and generalized distribution plots
- 3.6. Fitting discrete distributions as generalized linear models
- 3.7. Chapter summary
- 3.8. Lab exercises
Selected figures
view R code-
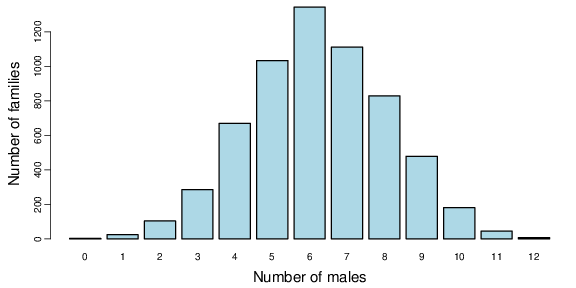
Figure 3.2
Number of males in Saxony families of size 12. -
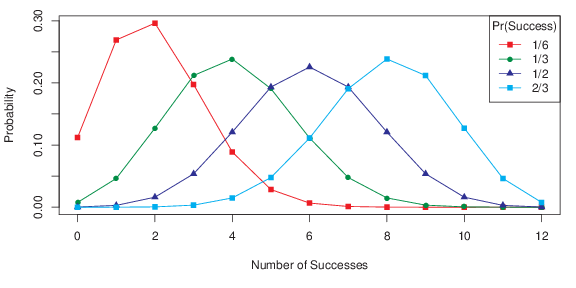
Figure 3.9
Binomial distributions for k=0, ..., 12 successes in n=12 trials and four values of p. -
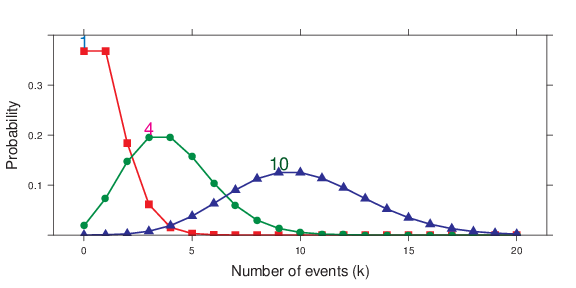
Figure 3.11
Poisson distributions for lambda = 1, 4, 10, using direct labels. -
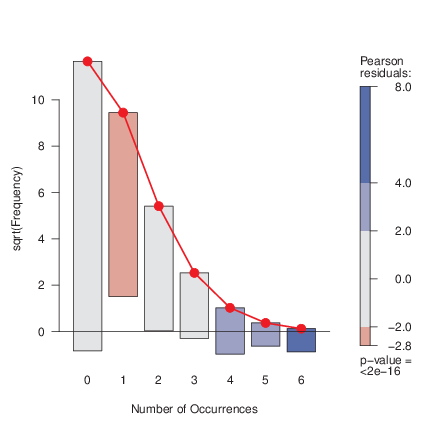
Figure 3.15
Hanging rootogram for the Federalist Papers data, fitting the Poisson model. Color reflects the sign and magnitude of the contributions to lack of fit. -
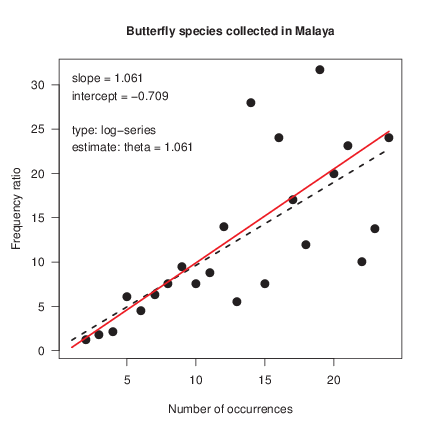
Figure 3.18
Ord plot for the Butterfly data. The slope and intercept in the plot correctly diagnoses the log-series distribution.