Chapter 1: Introduction
Summary
Categorical data consist of variables whose values comprise a set of discrete categories. Such data require different statistical and graphical methods than commonly used for quantitative data. The focus of this book is on visualization techniques and graphical methods designed to reveal patterns of relationships among categorical variables. This chapter outlines the basic orientation of the book and some key distinctions regarding the analysis and visualization of categorical data.Contents
- 1.1. Data visualization and categorical data: Overview
- 1.2. What is categorical data?
- 1.3. Strategies for categorical data analysis
- 1.4. Graphical methods for categorical data
- 1.5. Chapter summary
- 1.6. Lab exercises
More information
- Chapter 1 PDF This chapter is avalable for free download.
Selected figures
-
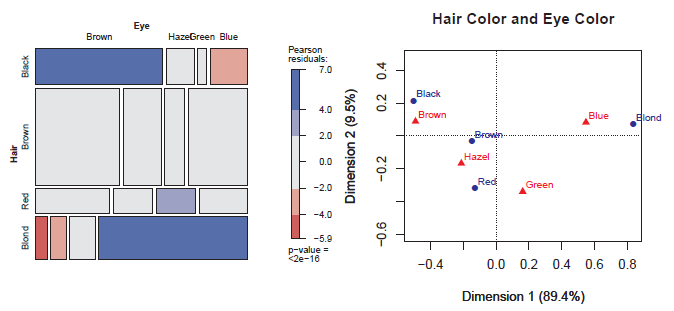
Figure 1.1
Graphical displays for the hair color and eye color data. Left: mosaic display; right: correspondence analysis plot. -
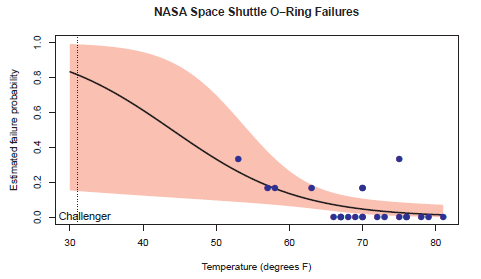
Figure 1.2
Space shuttle O-ring failure, observed and predicted probabilities. The dotted vertical line at 31◦ shows the prediction for the launch of the Challenger. -
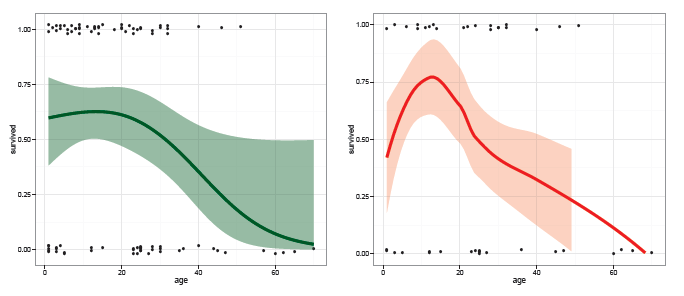
Figure 1.4
Donner party data, showing other model-based smoothers for the relationship between age and survival. Left: using a natural spline; right: using a non-parametric loess smoother. -
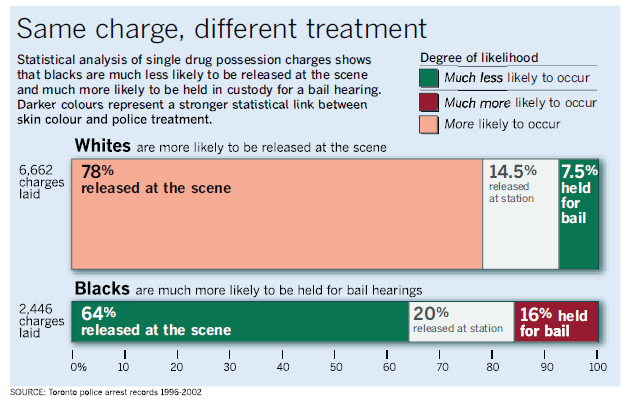
Figure 1.8
Redesign of Figure 1.7 as a presentation graphic. -
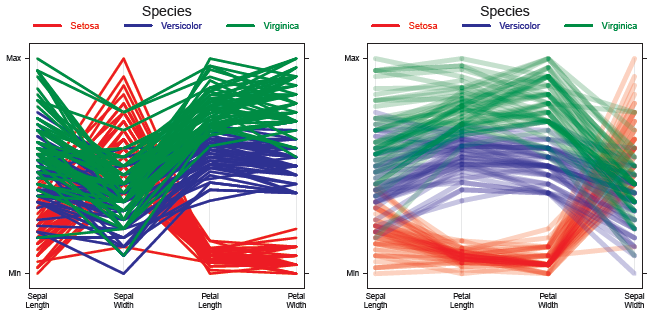
Figure 1.11
Parallel coordinates plots of the Iris data. Left: Default variable order; right: Variables ordered to make the pattern of correlations more coherent. -
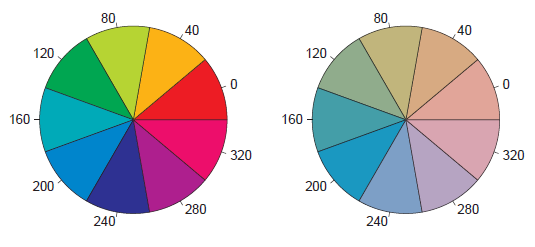
Figure 1.15
Qualitative color palette for the HSV (left) and HCL (right) spaces. The HSV colors are (H, 100, 100) and the HCL colors (H, 50, 70) for the same hues H. Note that in a monochrome version of this page, all pie sectors in the right wheel will be shaded with the same gray, i.e., they will appear to be virtually identical.