Chapter 6: Correspondence Analysis
Summary
Correspondence analysis provides visualizations of associations in a two-way contingency table in a small number of dimensions. Multiple correspondence analysis extends this technique to n-way tables. Other graphical methods, including mosaic matrices and biplots, provide complementary views of loglinear models for two-way and n-way contingency tables, but correspondence analysis methods are particularly useful for a simple visual analysis.Contents
- 6.1. Introduction
- 6.2. Simple correspondence analysis
- 6.3. Multi-way tables: Stacking and other tricks
- 6.4. Multiple correspondence analysis
- 6.5. Biplots for contingency tables
- 6.6. Chapter summary
- 6.7. Lab exercises
Selected figures
view R code-
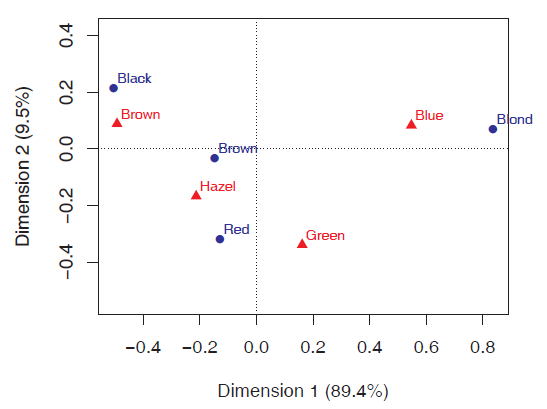
Figure 6.1
Correspondence analysis solution for the hair color and eye color data. -
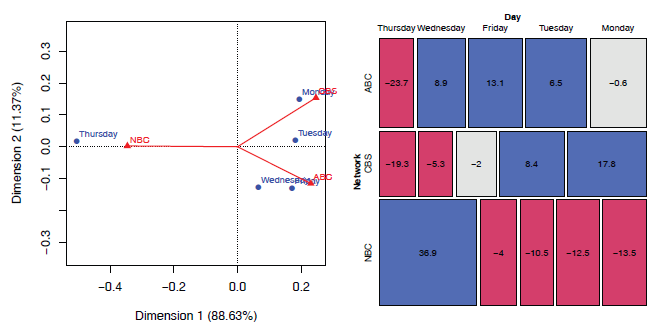
Figure 6.4
CA plot and mosaic display for the TV viewing data. The days of the week in the mosaic plot were permuted according to their order in the CA solution. -
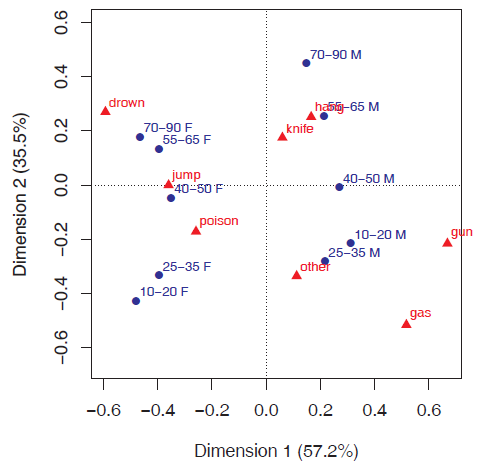
Figure 6.6
CA solution for the stacked [AgeSex][Method] table of the suicide data. -
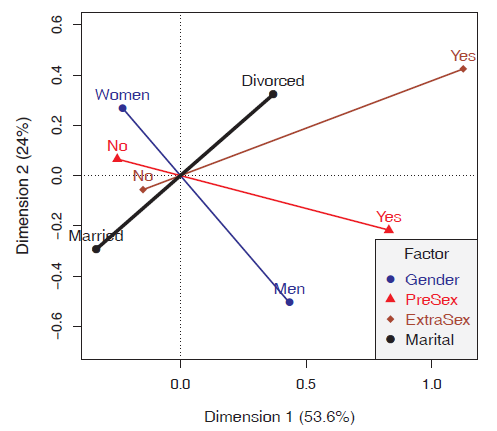
Figure 6.10
MCA plot of the Burt matrix for the PreSex data. The category points are joined separately by lines for the factor variables. -
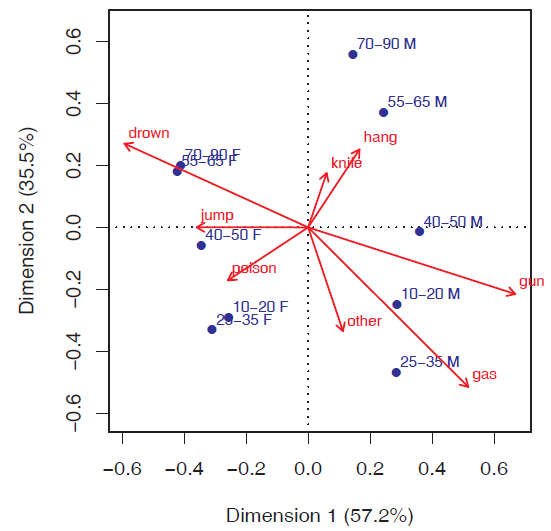
Figure 6.13
CA biplot of the suicide data using the contribution biplot scaling. Associations between the age–sex categories and the suicide methods can be read as the projections of the points on the vectors. The lengths of the vectors for the suicide categories reflect their contributions to this representation in a 2D plot.